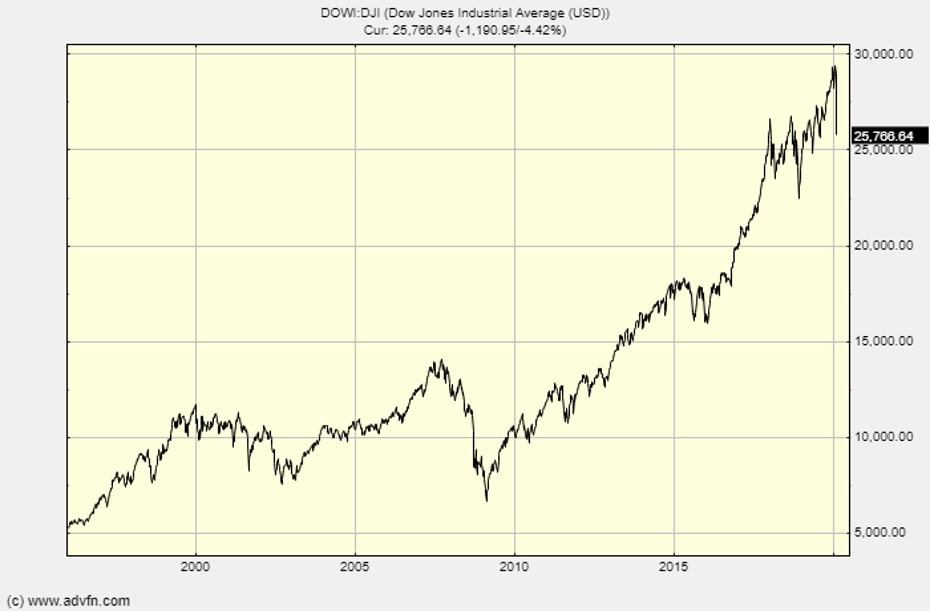
 Yesterday I managed to buy some put option on the Dow Jones Industrial Average at a reasonable price – before the worst of the sell off. They are June expiry 200 options. They rise in value as the Dow Jones falls. I’ve already made a substantial paper gain but will wait sometime before I sell. As you know, I’ve been banging on about the stretched valuation of the US market and the over-indebtedness of many companies (in America, China and Europe) for a long time. Thus for at least two years I’ve been buying put options on the Dow. I had no idea what the trigger would be but figured that when stock market exuberance comes on top of excessive debt we’re standing at a precarious position that may lead to a tipping point. The trigger for a sell off might have been war, disappointment with a few leading companies, a banking crisis, trade encumbrances, or any one of a dozen causes. It’s turned out to be a virus. So, for two years I’ve paid premiums to hold these options at regular intervals, and, when the expiry date went by, I lost everything I’d put into options. Before the expiry of one lot of options I bought another load, with expiry dates 6-9 months later. It was disheartened to see my insurance premium money flow out and get nothing in return. But that is what insurance is like – when the bad event happens you are covered, meantime you lose premiums. I still hold March expiry 185 puts on the Dow as well as these June expiry options. The 185 puts will be worth nothing if the Dow remains above 18,500 between now and the expiry date of 20th March. I have until 19th June for the options I bought yesterday to move “into the money”. Previous newsletters on the Dow and puts: 8th Feb 2019, 20th & 26th June 2017, 20-21st Dec 2017, 24th Sept 2018, 8th July 2017, 29th Aug 2019. Over-priced market? Looking at Professor Robert Shiller’s (Nobel Laureate) CAPE, which he updates regularly on his website – see chart below – we find that the recent level of 31.49 is almost double the historical average. There have been two occasions when it was higher. They are 1929 and 1999! CAPE = Cyclically adjusted price earnings ratio. Take the last ten years of earnings per share and average them. Divide the current share price by the average EPS. It’s designed to allow for a range of economic circumstances in the earnings number used when considering current valuations. 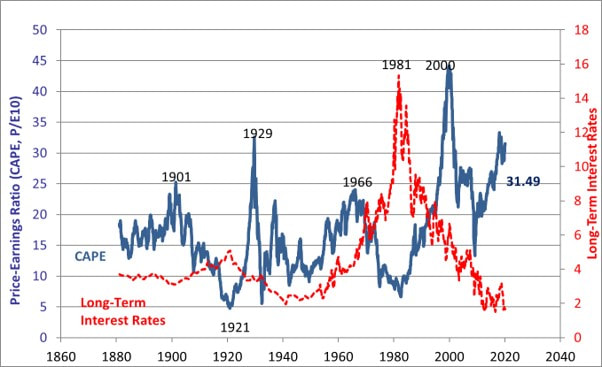 It has been used as an indicator of likely future performance: it’s been found that when CAPE is low shares tend to do very well over the next 5 years. Conversely, when CAPE is high they do badly.
I’ve written a lot on debt levels in other newsletters (see list above), but I was struck by a statistic in The Economist this week: of all the rich world’s established companies one in eight does not make enough profit to cover interest payments, let alone principal – and this at a time of absurdly low interest rates. An economic shock on the scale of Covid19 could tip thousands of companies into financial distress. The put options I bought yesterday The exercise price of the put option I purch ………………To read more subscribe to my premium newsletter Deep Value Shares – click here http://newsletters.advfn.com/deepvalueshares/subscribe-1
0 Comments
Leave a Reply. |
Glen ArnoldI'm a full-time investor running my portfolio. I invest other people's money into the same shares I hold under the Managed Portfolio Service at Henry Spain. Each of my client's individual accounts is invested in roughly the same proportions as my "Model Portfolio" for which we charge 1.2% + VAT per year. If you would like to join us contact [email protected] investing is about making the right decisions, not many decisions.
Categories
All
Archives
May 2023
|

 RSS Feed