|
The OECD estimate that United Kingdom GDP will fall by 14% in 2020 if there is a second virus outbreak later in the year (the double-hit scenario).
Even if the Covid-19 crisis eases considerably from this point and the economy opens up UK GDP falls by 11.5% this year. That represents an awful lot of bust businesses and unemployed people. Many will cut back on spending. “In the double-hit scenario, the unemployment rate is set to more than double to 10% and remain elevated throughout 2021, despite widespread use of furloughing.” In the double hit scenario consumers buy 18.5% less stuff this year than in 2019, and then increase consumption 5.2% in 2021. Thus customer-facing businesses, and many others, will suffer a protracted loss of income and balance sheets will deteriorate. Business investment will fall by over 23% this year and only move up by 4.8% next year. Thus, those companies selling capital items, such as plant and machinery are going to have a challenging couple of years. “Downside risks come from the risk of longer-term scarring of the economy due to higher unemployment and business closures. There is considerable uncertainty about how prolonged restrictions on activity or lower than expected demand would affect financial stability. A failure to provide credit to capital-w ………………To read more subscribe to my premium newsletter Deep Value Shares – click here http://newsletters.advfn.com/deepvalueshares/subscribe-1
0 Comments
A bleak economic outlook according to the Organisation for Economic Cooperation and Development23/6/2020 The Economic Outlook report published a couple of weeks ago predicts very poor prospects for most economies and businesses over the next two years.
It presents two possible scenarios: one where the virus continues to recede and remains under control, and one where a second wave of rapid contagion erupts later in 2020. A single-hit scenario: The current containment measures are assumed to successfully overcome the current outbreak, with the effective reproduction rate declining and staying persistently below unity. Higher hospital capacity and the widespread roll-out of effective testing, tracking and treating are assumed to be sufficient to prevent a resurgence in infections and intensive cases later in the year and until a vaccine becomes available. A double-hit scenario: The current easing of containment measures is assumed to be followed by a second, but less intensive, virus outbreak taking place in October/November. This could be because of seasonal factors in some countries, particularly in the Northern Hemisphere, or because containment, test, tracing and isolating is not as efficient as expected. It could also reflect insufficiently high cumulative infection rates to generate adequate herd immunity, a lack of suitable treatment measures and the unavailability of a vaccine. Further outbreaks in 2021 are assumed to be avoided due to pharmaceutical breakthroughs, but these remain a significant downside risk. Which is more likely – a double or a single? The following chart, from the Financial Times, shows that in many countries COVID-19 infections are still in the first rapid growth phase and not even close to receding. In the case of the USA the number of confirmed cases reached 30,000 in March and then fell to just under 20,000. In the last two weeks, however, it has moved back to over 27,000 and is expected to move higher still as the consequences of easing lockdowns feed through. The UK has managed to get its daily new cases down to 1,200. But that is merely the officially confirmed cases. The reality is that at least three times that number each day in our society catch the disease and potentially pass it on (the average pass on rate is a little below one person passes on to one person). And we hear this morning that Boris Johnson will overrule scientists and open up the economy including 1 metre distancing, opening pubs etc., which means many people will barely social distance (daily new cases in other countries relaxing lockdown: France 483, Germany 575, Italy 204, Spain 573). The greater risk of a resurgence in the UK means I will pay more attention to the OECD’s second wave scenario in what follows. OECD main findings “By the end of 2021, the loss of income [globally] exceeds that of any previous recession over the last 100 years outside wartime, with dire and long-lasting consequences for people, firms and governments.” The consequences of one-seventh of the normal output of UK goods and services not appearing this year are bad enough to bear, but the even worse news is that we don’t get all of that level of activity back for a very long time. The OECD say: "The recovery is likely to be hesitant and could be interrupted by another coronavirus outbreak if targeted containment measures, notably test, track and trace (TTT) programmes, are not put in place or p ………………To read more subscribe to my premium newsletter Deep Value Shares – click here http://newsletters.advfn.com/deepvalueshares/subscribe-1 Ben Inker is GMO’s Head of Asset Allocation (GMO is a $118bn fund). In GMO’s most recent letter he offered some thoughts on the economy and the market. The title puts his argument pithily “Uncertainty has seldom been higher; oddly, neither has the stock market”.
Since March we have had six years of “normal” equity returns in the space of less than two months, “Meanwhile, our estimate of the downside risks to the global economy have not notably lessened.” The GMO team have taken advantage of this contradiction by selling off equities and increasing long/short trades which allow increased exposure to relatively cheap shares but reduce “the portfolio’s sensitivity to overall market direction”. I’m guessing, but I think what that means is that a lot of money is used to gain exposure to the upside of the market, e.g. going long by buying shares in, say Proctor and Gamble. This trade is matched by the same amount of money taking positions shorting a matched company, say Unilever, or shorting the market as a whole, e.g. through derivatives such as options or futures. At the same time a bunch of deep value shares have been bought. Thus, the long/short combination allows them to be sanguine about the market’s movements – if it goes down they gain on the Unilever short say while losing on P&G long position, etc. But being long on value investments allows a good overall return when the neglected, unloved shares out-perform. (I’ve gone someway down this road myself with a combination of put options on the Dow and the holding of value investments reducing my concern about market direction, i.e. I’m OK markets fall because I gain on the put options; and I’m OK if markets rise because I gain on the value shares) Nothing but good news is expected Inker says that the markets seem to be pricing in something close to the best-case scenario. This is possible if a vaccine/treatment is found quickly. But in the absence of that “we believe substantial losses would b………………To read more subscribe to my premium newsletter Deep Value Shares – click here http://newsletters.advfn.com/deepvalueshares/subscribe-1
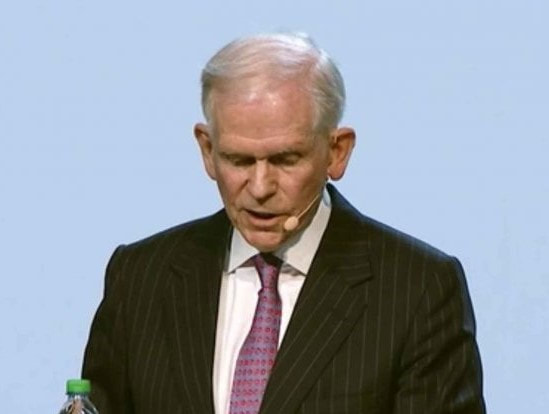
Billionaire investor Jeremy Grantham was brought up in my part of the world; a Doncaster lad who studied economics at Sheffield University (he also picked up an MBA from Harvard - wherever that is).
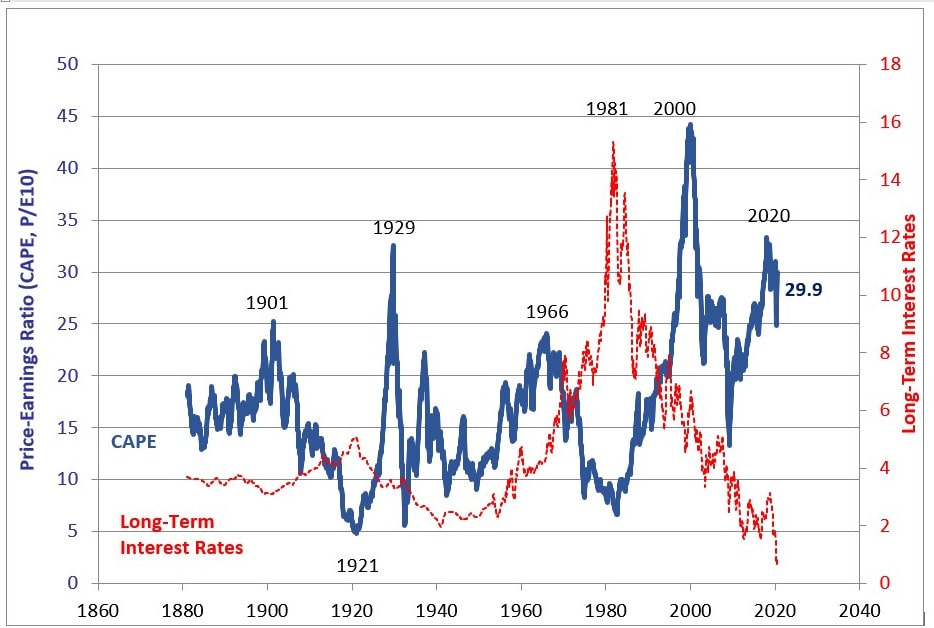
He is co-founder and chief investment strategist of the $118bn GMO asset manager. His particular interest is bubbles, and last week he gave his views on the position of financial markets currently in the context of the history of bubbles. He is not positive on the equity markets. I’ll outline his current views in the next newsletter. In this one I’ll set out what his thoughts were in 1999 and in 2007. Throughout his career he has put much emphasis on the idea of "reversion to the mean." Assets and markets when at highs and lows will move back to – or overshoot – their historical levels. His focus is on a long-term horizon - seven years into the future (it used to be ten). GMO may take extreme investment positions when there is a significant deviation from historical means. Before the Dot-com bubble burst In 1998 and 1999 Grantham refused to invest his client’s money in over-priced equities, i.e. most of the available equities. As a result, he lost 60% of assets under management as frustrated investors took their money away from him, disappointed with the performance of his funds relative to the 1998-99 market. He reflected on this period during a 2009 Forbes interview: “We just assume that at the end, in those days, of 10 years, profit margins will be normal and price-earnings ratios will be normal. And that will create a normal, fair price. And more recently, we’ve moved to seven years, because we’ve found in our research that financial series tend to mean revert a little bit faster than 10 years …And that's how we do it. And it just happened from October '98 to October of '08, the 10-year forecast was right… And on my birthday, October the 6th, the U.S. market, 10 years and four trading days later, hit exactly our 10-year forecast of October '98, which is worth talking about if only to enjoy spectacular luck. The P/E was a little bit lower than average and the profit margins were a little bit higher, so they beautifully offset. And given our methodology, that would mean that on October the 6th, the market should have been fairly priced on our current approach. And indeed it was. … the magnitude of the overrun in 2000 was legendary. As historians, you know we’ve massaged the past until it begs for mercy. And we saw that it was 21 times earnings in 1929, 21 times earnings in 1965 and 35 times current earnings in 2000. And 35 is bigger than 21 by enough that you’d expect everyone would see it. Indeed, it looks like a Himalayan peak coming out of the plain. And it begs the question, “Why didn’t everybody see it?” And I think the answer to that is, “Everybody did see it.” But agency risk or career risk is so profound, that even if you think the market is gloriously overpriced, you still have to get up and dance. Because if you sit down too quickly… …you’re likely to get yourself fired for being too conservative. And that’s precisely what we did in ’98 and ’99. We didn’t dance long enough and got out of the growth stocks completely, and underperformed. We produced pretty good numbers, but they’re way behind the benchmark. And we were fired in droves. I think our asset allocation, which is the division I’m now involved in, we lost 60% of our asset base in two-and-a-half years for making the right bets for the right reasons and winning them. But we still lost more money than any other person in that field that we came across, which is a fitting reminder that career risk runs the business.” Many clients went back to GMO once they had been proved correct. The chart below shows the movement back to a long run ………………To read more subscribe to my premium newsletter Deep Value Shares – click here http://newsletters.advfn.com/deepvalueshares/subscribe-1 On Thursday I bought put options on the Dow Jones Industry Average Index. The exercise price is 180 and this right to exercise expires on the third Friday in December. I’ll explain.
Let’s start with what a put option is: a right, but not an obligation, to sell the underlying at a fixed price at some point in the future or over a period of time. Applying that to the Dow: when I bought on Thursday the underlying, i.e. the DJIA stood at 26,000. A put option gives me the right to sell the Dow at a set price in December. A slight complication: instead of the straightforward Dow the DJIA number is divided by 100 for the option contract. Thus if the real Dow is at 26,000 the option that is “at the money” is expressed as 260 (an at the money option has an exercise price the same as the current market price). Each of those points is worth $100. I’ll illustrate with the put that I purchased on Thursday: I bought the right but not the obligation to sell at 180. If I was to go ahead and exercise my right I would be selling 180 x $100 = $18,000. But, with index options I do not have to sell the underlying because these are what is called “cash settled”. That is, only the difference between 180 and the value at expiry is paid over in cash (I don’t sell the 30 different company shares making up the Dow). Obviously, I would not want to exercise the right to sell at 180 when the market is at 260. This means that the option does not have intrinsic value (it is “out of the money”). If I had bought a 270 put option instead I would have the right to sell at 270 x $100 = $27,000. And I could buy that index at 260 x $100 = £26,000 to offset. Overall a profit. This put option has intrinsic value of 10 points or $1,000 (it is “in the money”). But such an option costs a lot more than the heavily out of the money one I did buy. I paid 3.90 points for the right to sell at 180. Those 180 points are worth 180 x $100 = $18,000, whereas my option cost 3.90 x $100 = $390, which is 2% of the underlying. I have between now and the third Friday in December for my option to gain some intrinsic value. It will not do so if the Dow stays above 18,000. So, if the underlying fell to 170 (that is 17,000 on the real Dow) I would have the right to sell at 180 while being able to “buy” at 170. The market organiser (CBOE in Chicago) will cash settle with me for 10 points per contract (180 – 170), each point worth $100, thus sending me $1,000 in December. Thus, I have a highly geared position on the Dow. For a large range of Dow values in December I receive nothing, but when (or, rather, IF) the Dow falls below 18,000 I start to gain quite high percentages. If the Dow falls all the way to 14,000, off about 46% from its current level, then the amount I receive is 9 times the amount I put down as a premium – see table. Real Dow in DecemberDow for the purpose of option pricingI can sell atNumber of points differenceValue of optionPercentage change for the 3.90 points x $100 = $390 paid for each option 26,000260180negativeExpires worthless – all option premium lost-100% 18,0001801800Expires worthless – all option premium lost-100% 17,00017018010 ………………To read more subscribe to my premium newsletter Deep Value Shares – click here http://newsletters.advfn.com/deepvalueshares/subscribe-1 Character Group (LSE:CCT) has a very good record of producing high profits and return on capital employed. Today we take a closer look at profits generated relative to net tangible assets under the control of the directors.
Profits, assets and liabilities ................ .........(For 2015-19 I’ve put “cash needed for operations” equal to short term borrowings because there are certain times of the year, especially in the months leading up to Christmas when the company is borrowing to pay for inventory and receivables. Currently, this money comes from overdraft, factoring, invoice discounting and import loans. But, conceivably, the directors might decide to use some cash to reduce borrowings and thereby save on interest and lower financial risk.) Return on net tangible assets, RONTA = Profit for shareholders ÷ Average net tangible assets over the year (beginning BS and end BS averaged). Return on tangible assets, RONA = Profit for shareholders ÷ Average net assets over the year (includes internally generated intangible assets capitalised) £’000s 2019 2018 2017 2016 Profit for shareholders 9,090 9,612 10,050 10,787………………To read more subscribe to my premium newsletter Deep Value Shares – click here http://newsletters.advfn.com/deepvalueshares/subscribe-1 With owner earnings we’re trying to obtain the earnings that, in future, would be left for shareholders after the managers’ use of the cash generated to pay for items of expenditure to maintain the strength of the economic franchise, maintain unit volume and to invest in all value-generating projects available.
Depending on circumstances, the owner earnings figure may be the same for every future year or on a steadily rising (or falling) trend. Naturally, owner earnings are impossible to obtain with any degree of precision because many of the input numbers are merely educated guesses about the future. Despite this imprecision it remains an important method for thinking through valuations. Owner earnings analysis is about future cash available for shareholders to take out of the business. But the only evidence we have available is past data. We start with that, and then use qualitative analysis to judge whether to simply project forward the past pattern or modify the previous trend for future orientated thinking. In the following we use what the company actually invested in new working capital items and in new fixed capital items, and what they spent on marketing, R&D and staff training etc. already deducted from the P&L. What the analysis really requires is the amount necessary to maintain the quality of the economic franchise, unit volume and invest in value generating projects. When we move to forward-looking analysis to value the firm we need to make another bold assumption on the real amount needed to invest in new WC, fixed capital items, etc., in the future. The historical analysis helps us make that judgment. “Owner earnings” in the past £m 2019 2018 2017 2016 2………………To read more subscribe to my premium newsletter Deep Value Shares – click here http://newsletters.advfn.com/deepvalueshares/subscribe-1 Piotroski analysis focuses on the likelihood of financial distress by examining trends or current states of nine accounting variables. I’ll examine Character Group (LSE:CCT) on both the annual figures and on the half year figures.
The first factor is profits Character Group has not had an unprofitable year for at least ten years. It was profitable in the latest six-month period. A Piotroski point is awarded merely for showing a profit. Does it produce positive cash flow from operations? Total cash generated from operations was £13.9m for the year to August 2019 and £4.4m in the six months to end February. It gains a second Piotroski point on both the annual analysis and six-month analysis. Has the return on capital employed figure improved? For 2018 net income before extraordinary items divided by beginning of year total assets was £9.5m/£69.9m = 13.6%. For the year to August 2019: £8.8m/£71.3m = 12.3%. Profits were much lower in the last half year compared with the same period a year before. The ROCE has declined for both the annual analysis and the six-month analysis, so Character does not gain a Piotroski point. Is cash flow greater than profit? Yes, for both the annual analysis and the six-month analysis, indicating that profit was not manufactured from accruals or other non-cash accounting, so another Piotroski point is gained. Has the ratio of long-term debt to start-of-year total assets improved? Character has no long-term debt and so it gains a Piotroski point in both annual analysis and six-month analysis. Is the current asset ratio on an improving trend?………………To read more subscribe to my premium newsletter Deep Value Shares – click here http://newsletters.advfn.com/deepvalueshares/subscribe- In the last two newsletters we noted that Character Group (LSE:CCT) has an impressive history of earnings and dividends. Today we ask if that is built upon a shaky balance sheet and poor cash flow.
Balance sheet data £m Feb20 Aug19 Feb 2019 Aug 2018 Aug 2017 Aug 2016 Inventories 10.6 16.4 11.2 10.9 9.0 10.3 Receivables 13.5 35.0 12.7 25.6 25.8 25.1 Cash 19.6 30.0 23.5 34.6 28.8 28.6 Investment property 1.6 1.7 1.7 1.7 1.8 1.8 Freehold land and buildings 2.5E 2.5 2.6E 2.6 2.7 2.8 Current assets plus saleable non-current assets 47.9 85.7 51.7 75.4 68.1 68.6 Short term borrowings -1.9 -22.2 -3.7 -19.1 -17.2 -21.6 Payables -12.1 -28.8 -14.7 -24.7 -22.7 -25.4 Other liabilities (long & short) -4.7 -3.0 -3.8 -1.9 -3.1 -1.3 Current assets + saleable N-C assets - liabilities 29.2 31.7 29.5 29.7 25.1 20.3 The market capitalisation of Character is £2.52 x 21.36m shares = £53.8m Borrowing For most of the year the company does not need to borrow or, if it does, only a small amount, hence the low borrowing level at the half year end in February 2020 (£1.9m). But in the months running up to Christmas CCT sends out a great volume of toys to retail customers such as Argos who won’t pay for the goods until their cash flows are high in December/January. Thus, CCT’s receivables number rises dramatically from around £13m most of the year to £25m - £35m in August, and to more in later months. This extra burden is financed mostly by factoring (up to £15m) and invoice discounting (up to £20m) for a few weeks, and to a lesser extent by import loans. Character also has an overdraft facility of £6m available. Interest on the overdraft factoring, invoice discounting and overdraft facilities is only 1.43% plus LIBOR or base rate. Its Far East subsidiaries also have bank overdraft and trade finance facilities of £17.9m. The Danish subsidiary, Proxy, has an ongoing recourse factoring facility of up to approximately £6.1 million. The interest charged on this facility is CIBOR 3 month/BOR (the Copenhagen interbank interest rate) plus 4.85% per annum. It also has a subordinated loan of £1.342 million where the interest rate is 12.8% per annum. These facilities are secured by various fixed and floating charges over the assets and undertakings of a Danish subsidiary and its subsidiaries. So long as the retailers pay up in the winter, Character can get………………To read more subscribe to my premium newsletter Deep Value Shares – click here http://newsletters.advfn.com/deepvalueshares/subscribe-1 |
Glen ArnoldI'm a full-time investor running my portfolio. I invest other people's money into the same shares I hold under the Managed Portfolio Service at Henry Spain. Each of my client's individual accounts is invested in roughly the same proportions as my "Model Portfolio" for which we charge 1.2% + VAT per year. If you would like to join us contact [email protected] investing is about making the right decisions, not many decisions.
Categories
All
Archives
May 2023
|

 RSS Feed