|
To gain an understanding of the qualities of this business we'll start with conventional earnings numbers and move on to the more sophisticated approach of owner earnings estimation (based on my April 2014 analysis - I'll update in a later Newsletter). 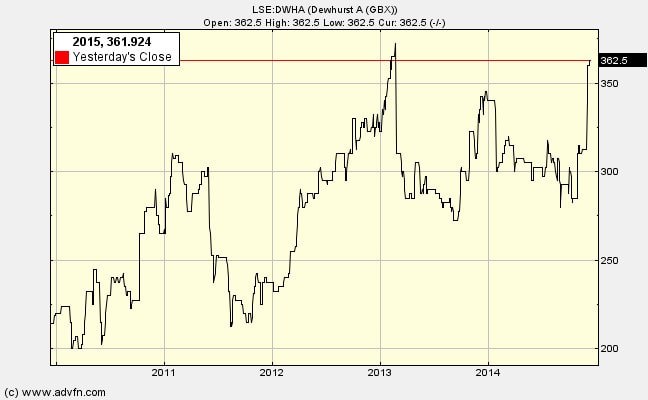 Conventional earnings per share and dividends per share analysis. In 31 out of the last 32 years the dividend has grown by 5% or more. 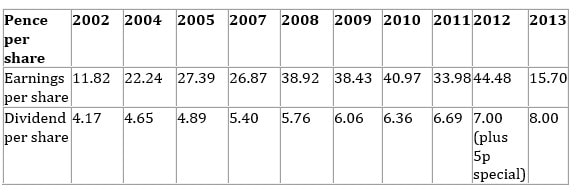 Estimated value per share using the dividend growth model and assuming an 8% pa required return with 5% pa future growth in dividend: Price = 8p ÷ (0.08 – 0.05) = 267p Note the very large dividend cover ratio. This might indicate that dividend could be raised significantly if the company does not have good internal projects to invest into. Price-earnings ratio for ‘A’ shares using average eps for 5 years: 320p ÷ 34.71p = 9.2 Owner earnings analysis (I first calculate what earnings were left for shareholders to take out of the business assuming that what the company actually invested in new working capital items and in new fixed capital items was the amount necessary to maintain the quality of the economic franchise, unit volume and invest in value generating projects. This is a bold assumption. When we move to forward-looking analysis to value the firm we need to make an another bold assumption on the real amount needed to invest in new WC and fixed capital items in the future. The historical analysis helps us make that judgment.) 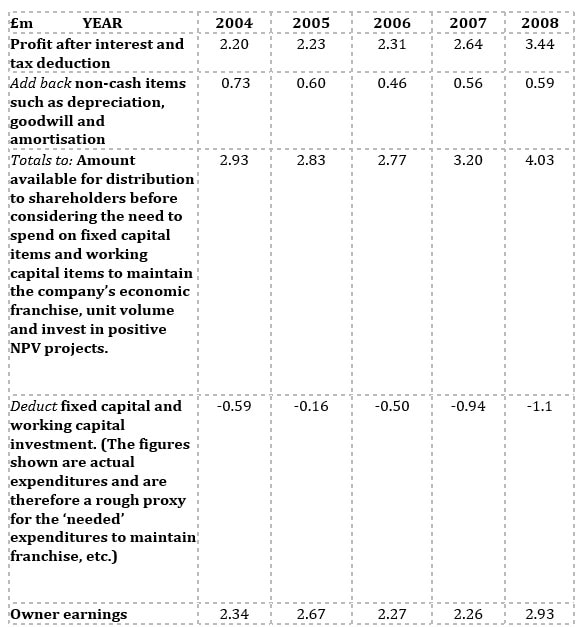 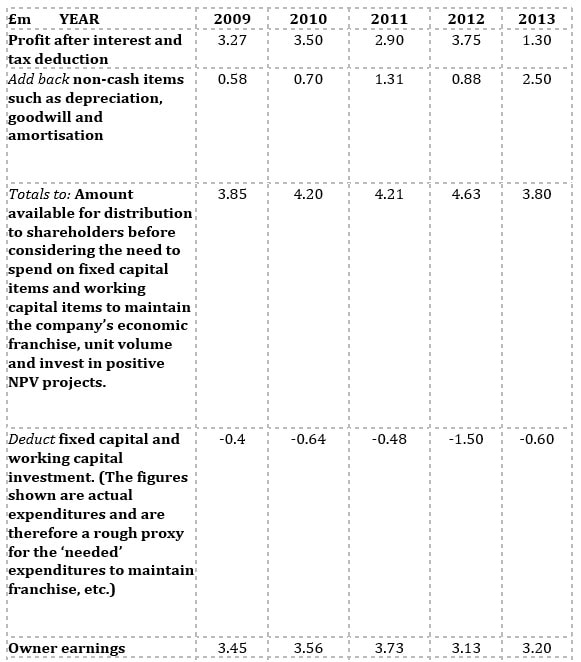 To estimate intrinsic value we could take a rough average of recent owner earnings numbers and assume either (a) that this will continue year after year with no growth, or (b) less conservatively, that the annual owner earnings number will grow by, say, 5% per year. Let us take £3.3m as the proven annual earnings power.
Intrinsic value = £3.3m ÷ 0.08 = £41.25m The company has 8.5 million shares in issue therefore the value of each share (ignoring the premium for voting rights) is £41.25m ÷ 8.5m = £4.85.
Intrinsic value = £3.3m ÷ (0.08 – 0.05) = £110m On a per share basis: £110m ÷ 8.5m = £12.94 In the next Newsletter Ill look at return on capital employed, balance sheet strength and managerial character
0 Comments
Leave a Reply. |
Archive
I wrote newsletters for almost 10 years (2014 - 23) for publication on ADVFN. Here you can find old newsletters in full. I discussed investment decisions, basics of value investing and the strategies of legendary investors. Archives
October 2020
Categories |
 RSS Feed