|
Previous blogs have highlighted Airea's low share price relative to net current asset value, and the bonus of extra value that might be tied up in property. We now look at another positive factor which allows us to offset a lower margin of safety on the assets side with a margin of safety on the income flow side. 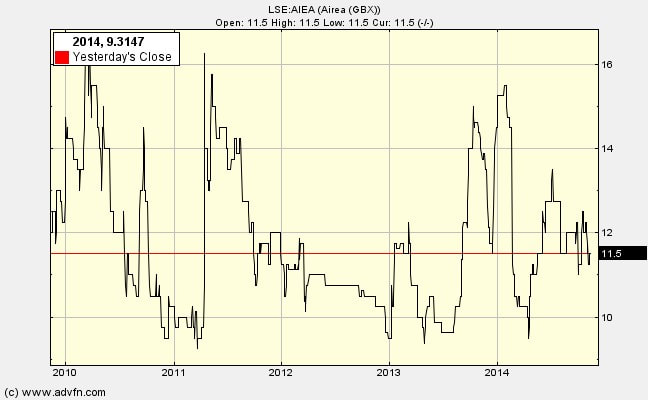 Here we are focused on the cash flows that could be taken out of the business without damaging the company’s economic franchise or reducing its unit volume of output or impacting the acceptance of value-generating projects. That is, the owner earnings. Before we look at owner earnings it is useful to understand what has happened with profits over the past five years. Profit after tax and before deducting exceptionals is fairly consistently in the £0.3m - £0.4m region and dividend yield is 5%. This is encouraging. However, the company also transfers about £0.4m to the pension scheme each year. Profit numbers 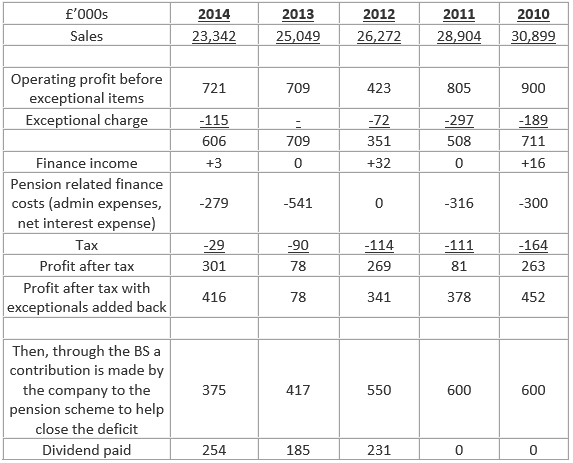 Thus after the pension contribution the company does not produce very much. But, profit is not everything. If we look at the cash flow elements of the annual report we find that in arriving at operating profit the company has annual deduction for depreciation of between £0.8m and £1.538m. Even today the depreciation rate is around £0.88m. This is largely a legacy of being a much bigger company with plenty of fixed assets. The depreciation figure must be compared with the actual outflow on capital items to gain an impression of the difference between profit numbers and owner earnings numbers. In 2013 fixed capital item expenditure was £0.257m and in 2014 it was £0.157m, much less than the depreciation deduction. Thus owner earnings is much higher than profits – see proxy owner earnings table. Proxy for owner earnings (These are only proxies because I’m using historical amounts actually spent on changes in working capital and fixed capital items rather than the future focused “required expenditure needed to main the firm’s economic franchise, unit volume and invest in value-generating projects”). 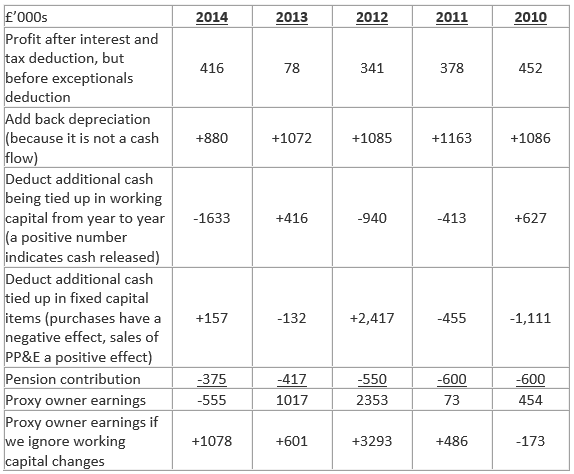 We need to make a judgement on future owner earnings, i.e. the cash that can be paid out to shareholders in future without impairing the company’s franchise, unit volume or investment in value-generating projects. If the firm is not growing then should the annual additional investment in working capital be assumed to be zero? For future years, on average, I think that is a reasonable assumption.
For a non-growing company annual fixed capital item expenditure is likely to be no more than £0.25m. Given these guesses a typical future annual owner earnings number can be estimated at (assuming no pick up in the economy):
Compared with a market capitalisation of £5.41m, that is not too bad. On the optimistic side there is potential for:
The next blog looks at the qualitative factors influencing the decision to inves
1 Comment
Airea (LSE:AIEA), which I bought last week at 11.7p per share, has a strong balance sheet but it is dominated by the pension deficit. So this blog takes a closer look at that. In the balance sheet summaries shown below the non-current liabilities are overwhelmingly due to the figure estimated for the pension fund deficit. You can see how much this figure moves about, impacting net current asset value, NCAV. Airea plc balance sheet items to 30th June 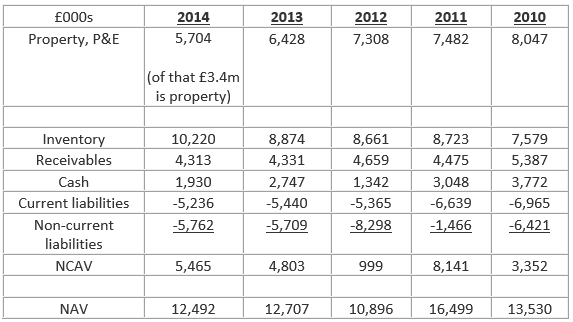 With such a large amount owing to pensioners a small change in the discount rate used to estimate present value has a large effect on the deficit. The current discount rate used is that of corporate bonds at 4.25%.
This is remarkably low compared with what the fund has used in the past. Indeed, in the history of the bond market 4.25% is a remarkably low number. If the discount rate was lowered by 0.1% then £0.63m will be added to the deficit. What are the chances of that worsening occurring? Here we need to make a judgment on the path of future interest rates in the bond markets. Will they go up or go down? If they rise by 1% to a more normal 5.25% then the pension deficit (ceteris paribus) disappears as the liability drops by £6.3m for every 1% point movement. Another way in which the deficit can be eliminated is if equity markets rose, increasing the value of the fund’s assets. On the other hand, Airea could be hit by a rise in life expectancy. If the average pensioner lived for one year longer than the current assumptions then £1.7m will be added to the liability. But the current assumptions do not seem too worrisome because the pension scheme was closed to the accrual of benefits in 2005 and the average age of a beneficiary is now 65. For actuarial calculations, on average Airea’s pensioners are estimated to live to 86.3 years for males and 88.5 years for females. What are the odds of these numbers having to be raised? Would the average pensioner have to live into their 90s for there to be a serious problem for this company? There are 53 active scheme members, 54 deferred pensioners and 70 pensions in payment. In the next newsletter I'll discuss the encouraging profit and owner earnings numbers for Airea. I've bought into another small company with a strong balance sheet and a lot of potential. Airea (LSE:AIEA) has a net current asset value more than its market capitalisation, but only by a narrow margin: NCAV is £5.465m whereas MCap is £5.41m (at a share price of 11.7p, my buying price). Normally, I would reduce the value of BS inventory and of receivables to build-in a margin of safety. This would lower the NCAV of Airea below MCap and therefore disqualify it from further consideration. 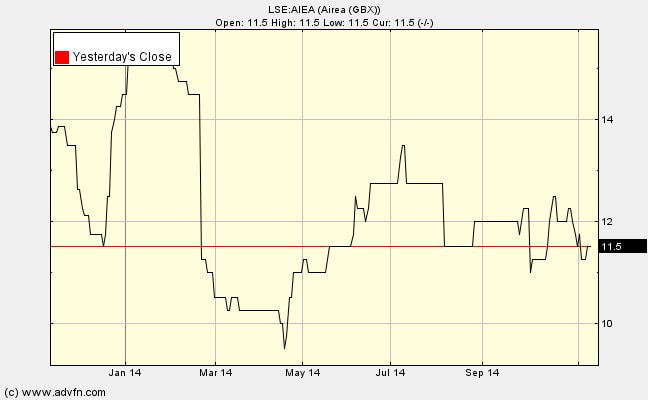 However, investing is not a mechanical exercise – we must employ judgement. I’m prepared to take a risk on two offsetting factors, one in the balance sheet and the other in the income/owner earnings. But, there is one big negative factor to consider: a large pension deficit. I would value your views on the points I make below – there is probably a great deal I have missed. Some background Airea used to be called Sirdar, a struggling textile company. In 2007 Sirdar sold off property, paid off debt, closed business operations, but held on to two divisions. The first is Burmatex which makes contract carpets and carpet tiles. Its target customers are architects, specifiers and contractors for the education, leisure, commercial, healthcare and public sectors. Think offices, schools and hospital floors covered in hard-wearing carpet. Most of the division’s £16-17m of sales are in the UK, but it does export, principally to Europe. Naturally, the long recession and government spending clampdown was not good for the business. With macroeconomic recovery matters might improve, but it remains a competitive business. I think I’m right in saying that Headlam is its main competitor with 10 times the turnover. Please correct me if I’m wrong here. The second division is Ryalux which makes posh wool carpets for the retail trade. It uses words like ‘bespoke’, ‘custom made’, ‘colour match’. Its slightly more affordable wool-rich range is Pownall. Turnover of around £7m, through retailers. The recession has held down this division too. Is it a coiled spring, to be released as the economy recovers? The balance sheet First note is that there is no debt, but there is £2m of cash. An intriguing aspect of the balance sheet is the great influence that the actuaries estimating the pension deficit have on the non-current liabilities. Virtually all the non-current liabilities shown in the BS is pension fund deficit. The present value of schemes liabilities is estimated at £46.9m whereas the fair value of the schemes assets are £41.2m. If the actuaries decide to lower the discount rate used to convert the liabilities to a present value the raised amount feeds directly into the current liabilities thus reducing NCAV. Given the importance of the pension deficit for both the BS and for the cash flow drain I’ll discuss it in more detail later. Airea plc balance sheet items to 30th June Rumour has it that the industrial property may be more valuable than the BS shows because there might be some potential for gaining planning permission to convert to residential. If you know anything about this could you let us know please. Thus £3.4m (or more) in property is one of the large positives for this company, beyond NCAV. Property has a stated value of 7.35p per share, compared with the current share price of 11.7p.
In tomorrow's blog I'll discuss the pension deficit So what might cause Holders Technology’s share price to rise? Here are some ideas. I would like to hear what you think. 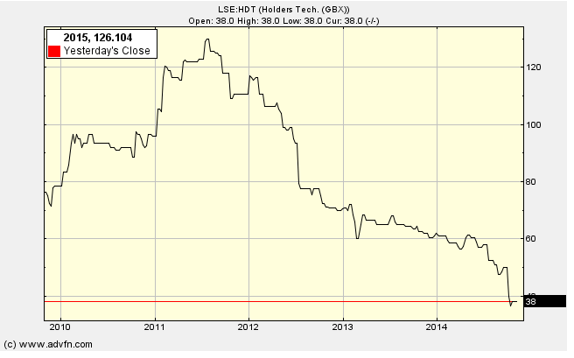 A checklist of recovery potential
I will be interested to hear your views on the following concerns:
What I have done - or, what have I done!!! I bought some shares at 42p last week to add to those I bought 10th October at 52p. Within hours of buying at 52p Holders Tech announced that a customer accounting for 10% of turnover cancelled its contract. I had to do some reassessing before continuing with this investment. I concluded that the large share price fall had more than compensated for the loss of 10% of turnover which, the directors say will be ‘mitigated by alternative strategies and cost reduction measures’. So I bought some more. I’ll put this holding in my 2014 NCAV portfolio at 47p, half way between my two buying prices. Holders Tech may have a strong balance sheet, a multiple of net asset over its market price, but does it have potential to create shareholder value through its operations or its liquidation? To arrive at a judgement we need to consider the management, the firm's business prospects and its stability: Managerial competence and integrity. On the positive side, the two key people have spent a large part of their adult lives working for this company. Rudi Weinreich (68) founded the company in 1972. He is Executive Chairman with 47% of the shares. He has strong incentives to revive the company from its moribund state. First his financial stake could rise in value, or at least the flow of dividends could increase. Second, this is something he created – surely he will want to create a better legacy than this? Victoria Blaisdell (42), Managing Director, joined in 2004 (shareholding 0.81%). The UK head joined 1996, German joint heads joined in 1993 and 2002. Judging by their statements, they are realistic and transparent about the difficulties of distributing products into these markets. In terms of integrity regarding small shareholders they have taken personal hits on remuneration over the last three years: 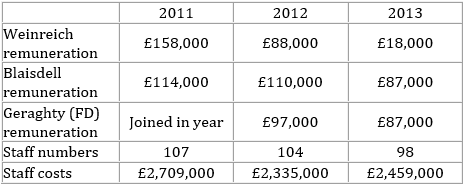 Thus there has been some alignment of shareholder returns and managerial returns.
There is a wider push on administration costs: “Total administrative expenses were reduced by £226,000 compared with 2012 so that administrative cost as a proportion of revenue decreased from 24% in 2012 to 21.4% in 2013” (2013 report) A very low level of capital expenditure – around £100,000 pa. They also continued to pay a dividend. But you have to be concerned that they have not found a way to consistently sell product above cost. Perhaps a good excuse is that the recession in Europe has depressed the more recent profit picture, but I might be clutching at straws. No independent directors Stability It is stable alright – no debt, virtually no pension deficit, turnover stable, assets to fall back on, stick to their knitting – but it is stable at a low level of profits over a span of years. Business prospects This is very cloudy because time and again in the past the managers have claimed that matters are improving and then the following year they report ‘strong competition’ and ‘over capacity’. Admittedly, some of the problems were due to the Chinese business draining financial and managerial resources. Now that has been disposed of they might be able to concentrate on finding a profitable niche. However, this quote from Ben Graham brings some comfort, as it makes clear that when you have a high margin of safety in NCAV and NAV, you do not need outstanding business prospects: “The buyer of bargain issues places particular emphasis on the ability of the investment to withstand adverse developments. For in most such cases he has no real enthusiasm about the company’s prospects. True, if the prospects are definitely bad the investor will prefer to avoid the security no matter how low the price. But the field of undervalued issues is drawn from the many concerns – perhaps a majority of the total - for which the future appears neither distinctly promising nor distinctly unpromising.” The next blog will conclude my analysis of Holder's Tech. Newsletter 16 - the power is in the balance sheet of holders tech (lse:hdt) 5th november 201422/7/2020 With a market capitalisation of £1.65m (3.94m shares x 42p) Holders Tech is priced very low relative to its balance sheet assets. Its share price is one-third of net asset value and only 40% of net current asset value. The balance sheet 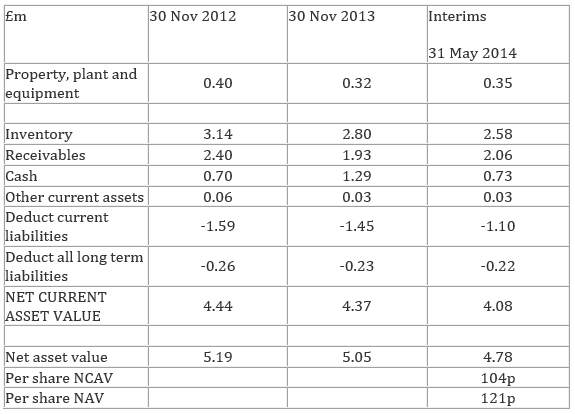 Total liabilities of around £1.3m with no bank debt is an incredibly conservative way of structuring a BS. Thus, even if one-half of inventory and one-half of receivables are valueless, i.e. we knock £2.32m off, there is still £0.73m in cash plus £1.29m inventory plus £1.03m receivables. This is still plenty to offset the payables and the tiny amount of other liabilities. Profits and dividends 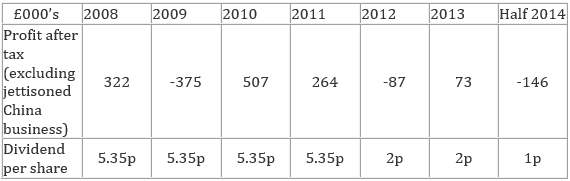 Clearly, the profit record is patchy. It is quite worrying that the managers cannot produce consistent profits.
On the other hand, due to the strong BS and very restrained testing of new business tactics the company maintained a dividend even through the bad years. The dividend yield is 4.76%. I also looked at cash flow from operating activities over 6 years. There is no discernable pattern other than an overall performance oscillating around zero. Some years cash flow is positive (e.g. 2013: +£750k, 2012: +£897) due to a rundown of working capital. Other years there is a build-up in working capital resulting in cash flow falling below earnings (e.g. operating cash flow 2011: -£459, 2010: -£777m). An ‘owner earnings’ analysis produces much the same conclusion – bobbing around zero. All in all the profit, cash flow and owner earnings history is far from encouraging. We must hope that something changes. In tomorrow’s newsletter I’ll look at the qualitative factors It was not easy to make up my mind on this company. On the one hand the Net Current Asset Value, NCAV, is more than double the current price (and net total assets per share are almost three times market price) On the other hand, the two markets in which the company operates are very competitive, with customers commanding so much power that sometimes Holders Tech can make a profit and in other years it cannot. On average, over 6 years, it has done no more than breakeven (including exceptional costs). Also the market capitalisation of only £1.7m means that it is a pretty illiquid share.
So, why did I invest? First, it meets the quantitative criteria in spades. Second, it does reasonably well on the qualitative criteria, with the exception of the industry economics. There is a good chance that it will continue in a weak position vis-à-vis customers in its product areas, and therefore this investment will turn out to be a dud. I estimate the probability of this occurring as greater than 50%. But, if it does find a way, either through managerial enterprise or shear good fortune, to consistently make profits the share price should at least double – it might even rise back to 169p it was in 2007. Even if the odds of the upside occurring are less than 50% it is worth it, especially given the underpinning of the current assets, very conservative financial structure and very unadventurous managers (unlikely to squander the cash and other assets). What it does Printed circuits board, PCB, manufacturers need components and other things. Holders Tech supplies them, mostly in Germany, UK and other places in Northern Europe. The ultimate use is in defence, aerospace, automotive, solar, medical and consumer products. Holders seems very keen to maintain market share by undercutting ‘competition from a wide range of companies’, which frequently leads to losses, but at least they have decades of experience and contacts in this business. LED lighting components and ‘solutions’. Started this 3-4 years ago and grew turnover rapidly, but still ‘we have yet to achieve critical mass’ in an industry with over-capacity. Currently investing in UK and German sales and management teams and in visiting trade exhibitions – which is the latest excuse for poor profits. It is trying to move into more technically sophisticated products; perhaps this will allow profits? In tomorrow’s newsletter I’ll examine its balance sheet and profit record. Since buying French Connection (LSE:FCCN) for 30.47p in July 2013 the shares have had a roller-coaster ride, up to 91p, and then down to 47p. At the current price of 53p, and market capitalisation of £50m should I buy some more 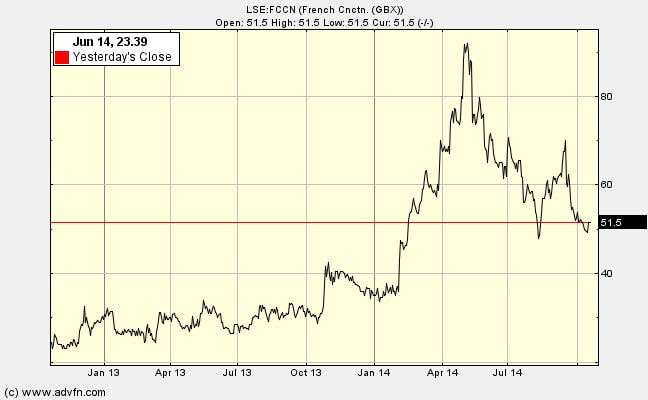 Given that this is a Net Current Asset Value investment, the first place to look is the BS: 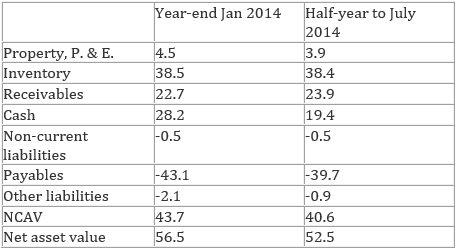 Over the past year NCAV has shrunk from £49.9m to £40.6m while market capitalisation climbed from £30m to £53m. And this comparison is made before we adjust down the BS values of inventory (say by one-third) and receivables (say by one-fifth) in order to offset any potential overly optimistic BS valuations.
There are encouraging signs on the quality of the operating business, even though the Group remains unprofitable: stores are being closed to reduce the drag of the loss-makers; LFL sales in UK/Europe Retail are up 6.6%, with less need to sell off stock in a seasonal sale; forward orders for Wholesale are up; overhead is down; licensing is still improving, and; there are good prospects for a continued rate of closure of non-contributing stores of around 8 per year in UK/Europe. In short, they have made a start on the long road to recovery: they seem to have better buyers attracting more customers and are lowering overhead. But… but…. losses of £3.9m for the latest half-year are worrying. They are clearly not out of the woods yet. The share price rise means that French Connection no longer qualifies as a NCAV investment. Furthermore it has not transformed itself into a candidate for my ‘strong economic franchise’ investment portfolio. If the share price falls to under 35p I will take another look because there would then appear to be sufficient margin of safety in the NCAV position. For now, I’m quite content to sit out the remaining four years until the selling horizon is reached for NCAV portfolios. If the managerial improvement continues this could be a ten-bagger. After all, the share was once (2004) over £5. Unlikely, but it could happen. If there are enough of these in the portfolio I expect to do well overall. I bought when the market capitalisation was £30m (share price 30p) and the Net Current Asset Value was greater at £49.9m. What was I thinking? This is what I posted on my personal website in 2013: Some positives 1. Cash at year end 31 January 2013: £34m, with no bank debt. January is a very advantageous point in the year to report net cash. However, even at the worst point net cash was reported as £10.6m during the year. Even better: in May 2013 it reported cash of £15.7m compared with £10.4m the previous year. Also no pension deficit. 2. NCAV 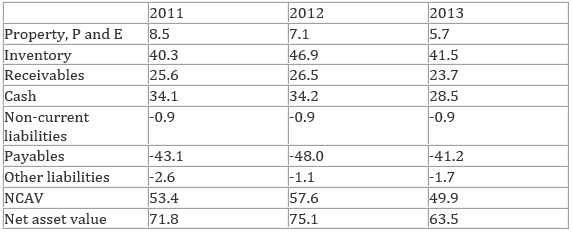 Bear in mind that Graham insisted that we reduce the reported receivables by one-fifth and the inventory by one-third of their reported value. Even with these deductions NCAV is significantly greater than market capitalisation. The question are:
(a) Whether inventory is really worth what the company says it is? (b) Whether cash will be squandered? 3. While UK/Europe retail is doing very badly, the licensing and wholesale business continues to thrive (with a few bumps). Licensing alone can generate £5-£9m with few capital requirements 4. All it takes for the turnaround is good design. New head of design in May 2013 New head of Retail in Sept 2012. New head of production in October 2012 New head of Multichannel October 2012 5. Asian growth: An aspirational brand in Asia, especially in China and India where operations are profitable and growing (opening 4 new stores in China this year and 10 in India). 6. Store leases in UK/Europe are likely to be for 15 years. This means that on average they have 7-8 years to run. Therefore over the next few years, store by store, they can (a) stem losses by selectively not renewing leases (b) get rent reductions in a hard hit store rental market. The cash available combined with further reductions in working capital requirement releasing more cash, will see them through the next few years. Disposals in 2012/13: 2 stores in UK/Europe, 3 in N America. In process of closing one store and 6 concessions. Likely to close two more this year. About 10% of leases up for renegotiation each year 7. e-commerce is rising in importance, now 10% of sales 8. Sell in 30 countries with 1,000 stockists. Skilled weeding out of unprofitable activities still leaves much to build upon. 9. Branded sales (wholesale and licences for glasses etc.) of £400m, on which royalties are paid. Brand is still powerful in some segments/geographies 10. Trading revenue is now generally flat rather than falling, but such green shoots could wither. 11. Founder determination not to be seen as a failure in the retail game I posted these comments on my website in July 2013 (after writing I bought at 30p): French Connection’s (LSE:FCCN) profit record is appalling. The only reason for looking at it is because it has net current assets much larger than market capitalisation and there are some reasons to believe that the assets will not be run down before profitability is restored. The fact that I put the probability of a return to health at less than 50% does not fatally wound the case for investment because if a turnaround is achieved the pay off will be 3-fold, 4-fold, 5-fold or more. There are many negatives to weigh against the positives. I would be interested to hear how you weigh them. Some data Share price: 30p Market capitalisation: £30m Net Current Asset Value (as reported): £49.9m (see post on 15.10.14 for NCAV definition) Revenue: Approx. 70% UK/Europe (141 shops, 71 stores in UK and 46 concessions in UK and Europe). Operating profit: UK/Europe: Retail lost £16m. Wholesale made £3.9m N. America (17 shops): Retail lost -£1.6m. Wholesale made £7.8m Rest of world: wholesale made £0.5m Other income: UK £6.8m, N.A. £0.7m, RoW £1.6m Reasons for doubt In most NCAV firms you will find several reasons to want to hold your nose. Let’s look at those negatives for FC first: 1. Record No value generated for shareholders for a very long time. A story of decline. There are some businesses where management do not have to be smart every day because the franchise can carry them through years of poor management, (e.g. Coca Cola, Disney, Diageo). In retail you need to be smart every day because there is always a competitor with great innovation and flair snapping at your heels – especially in fashion retailing. 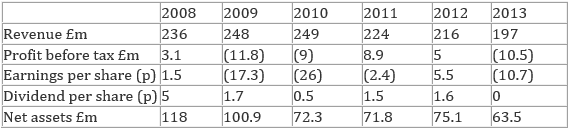 An owner earnings analysis does not make for comforting reading either 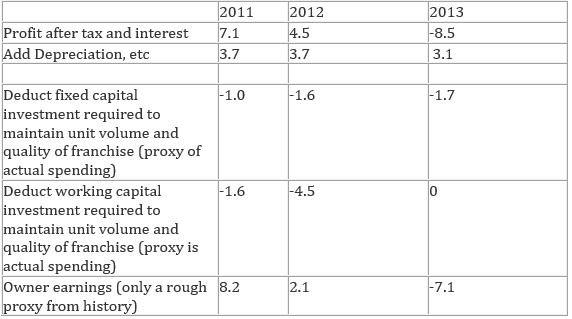 2. Comments from many sources that they still have not yet got the pricing and store display right in the UK/Europe stores, even if there may be a glimmer of light on the styling.
3. Comments, unconfirmed, that the dominant shareholder (42%), founder, chairman and CEO is domineering and inflexible 4. Lease obligations amounting to over £200m, but spread out over many years. Should they be included in liabilities? (if so, how do we account for the assets these obligations provide?) 5. Even the Board are not anticipating a quick turnaround; aiming for breakeven in the year ending 31.1.15. 6. The brand is old and faded. So far, the analysis is leading to a rejection – however, in the next blog I’ll look at some of the positives present in July 2013. |
Archive
I wrote newsletters for almost 10 years (2014 - 23) for publication on ADVFN. Here you can find old newsletters in full. I discussed investment decisions, basics of value investing and the strategies of legendary investors. Archives
October 2020
Categories |
 RSS Feed